New Jersey Forestry Association, Inc.
A non-profit tax exempt organization under IRS 501 (c) 3
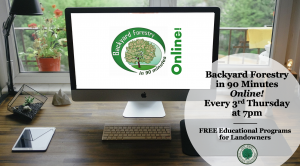
Founded in 1975, the NJFA is the only statewide organization supporting the sustainability and resiliency of NJ’s public and private forests through forestry education, and science-based forest management. The NJFA hosts the Backyard Forestry in 90 Minutes, Walk in the Woods, Tree Planting, and Woodland Stewards programs, produces member newsletters, and hosts an annual meeting. The NJFA is the go-to resource for legislators, agencies and other non-profits seeking comments on legislation and activities affecting NJ’s forests, and works jointly with public and private conservation groups.
The NJFA is the essential advocate for woodland owners, conservationists and others interested in maintaining New Jersey’s forests. If you value New Jersey’s forests – whether or not you are a landowner – and want to support our efforts, we welcome you to join the NJFA, participate in our activities and programs or donate (or all three!).